
This Electricity Energy Usage & Cost Power BI Dashboard provides a comprehensive view of electricity consumption patterns and the associated costs, helping users understand where energy is being used and how much it’s costing them.
It combines household-level energy usage analysis with national-level electricity supply data, allowing for both micro and macro perspectives on energy consumption.
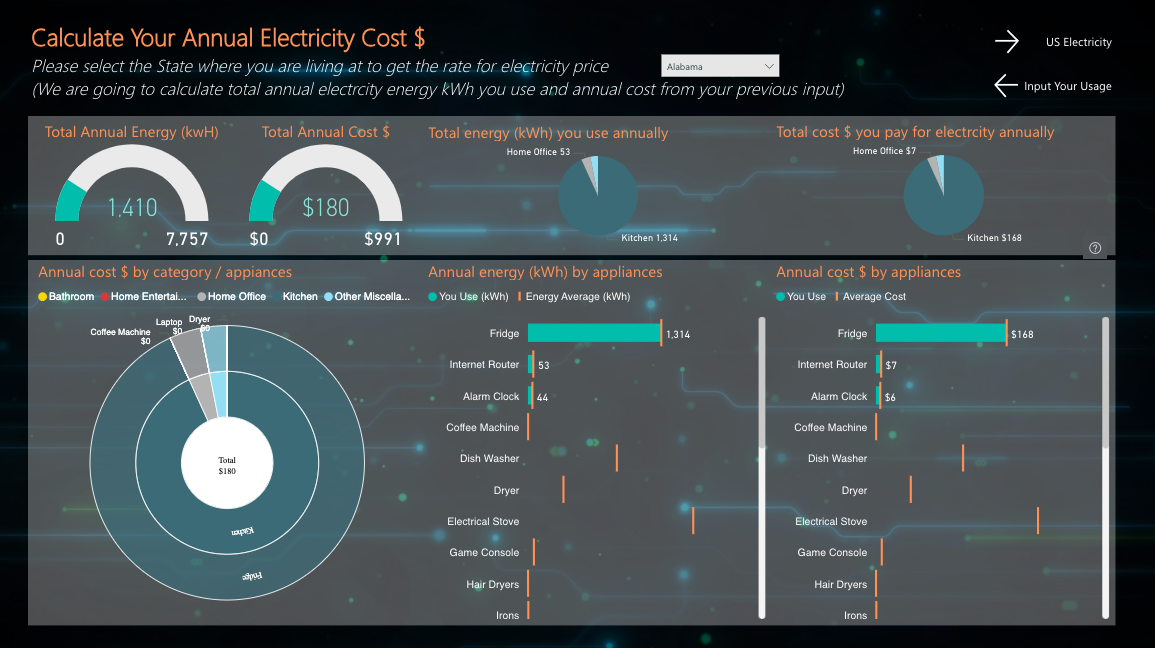
The dashboard calculates total annual energy (kWh) and cost based on state-specific rates, giving users accurate insights into their electricity expenses.
Visuals break down consumption by appliance and category, showing which devices contribute most to energy use and cost.
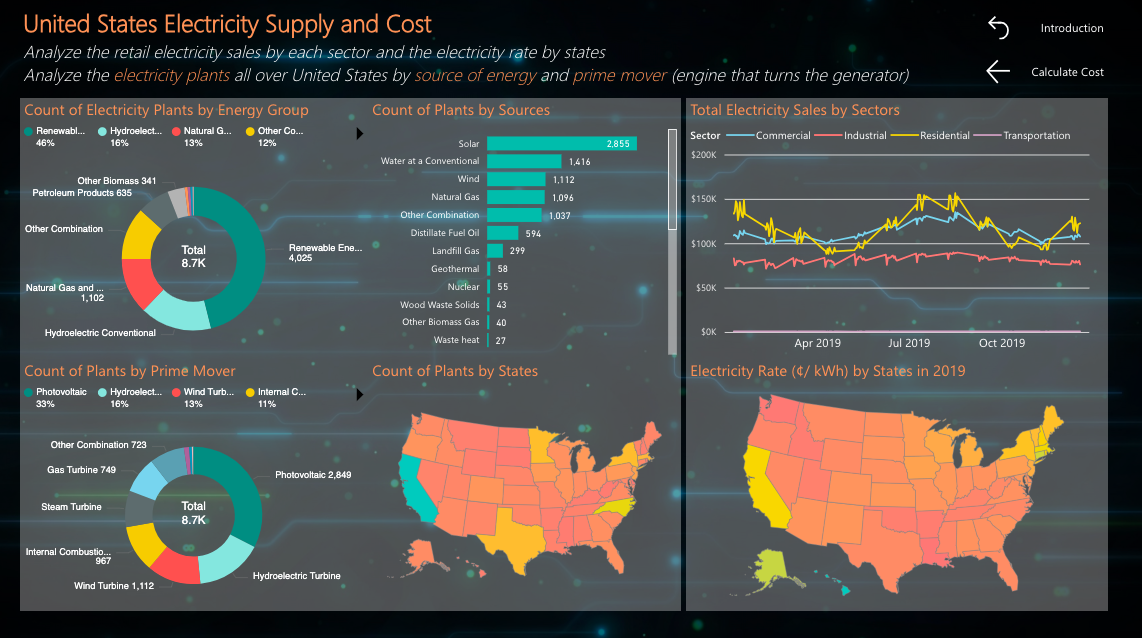
On the broader scale, the dashboard maps the distribution of power plants across the U.S. by energy source and prime mover type, while also tracking electricity sales trends across sectors and monitoring state-wise energy rates.
This dual-layer view makes it easy to pinpoint where energy efficiency can be improved and to understand how larger supply dynamics affect electricity costs.
Key Insights
-
Calculates annual energy use (kWh) and cost based on regional electricity rates
-
Breaks down energy consumption by appliance and category for granular visibility
-
Compares personal usage against average consumption benchmarks
-
Maps electricity plants by energy source and prime mover across U.S. states
-
Tracks electricity sales trends across commercial, industrial, residential, and transportation sectors
-
Displays state-wise electricity rates to identify high- and low-cost regions
Power BI Dashboards Worth Exploring:
- Retail Dashboard
- Airport Performance Dashboard
- Customer Analysis Dashboard
- HR Analytics Dashboard
- Inventory Insight Dashboard
- Sales Scorecard Dashboard
- Social Media Monitoring Dashboard
Practical Applications
-
Household Energy Planning: Identify high-consuming appliances to reduce electricity bills
-
Cost Optimization: Compare usage vs. cost to find opportunities for savings
-
Sustainability Efforts: Track energy-heavy categories to support eco-friendly choices
-
Utility Management: Analyze regional electricity rates to budget utility expenses
-
Policy & Research: Study electricity plant distribution and sector-wise trends for planning
Quick Recap
This dashboard is a powerful tool to understand how electricity is consumed and what it costs, from individual appliances all the way to national supply patterns.
By linking energy use, cost, and plant distribution, it equips users with actionable insights to lower their expenses and make informed energy decisions.
Check Out Other Power BI Dashboards:
- Team Performance Dashboard
- Attendance Tracker Dashboard
- Carbon Emission Footprint Dashboard
- Player Performance Dashboard
- Procurement Dashboard
- Healthcare Analysis Dashboard
- Weather Analysis Dashboard
- Transportation & Logistics Dashboard
Enjoyed the post?