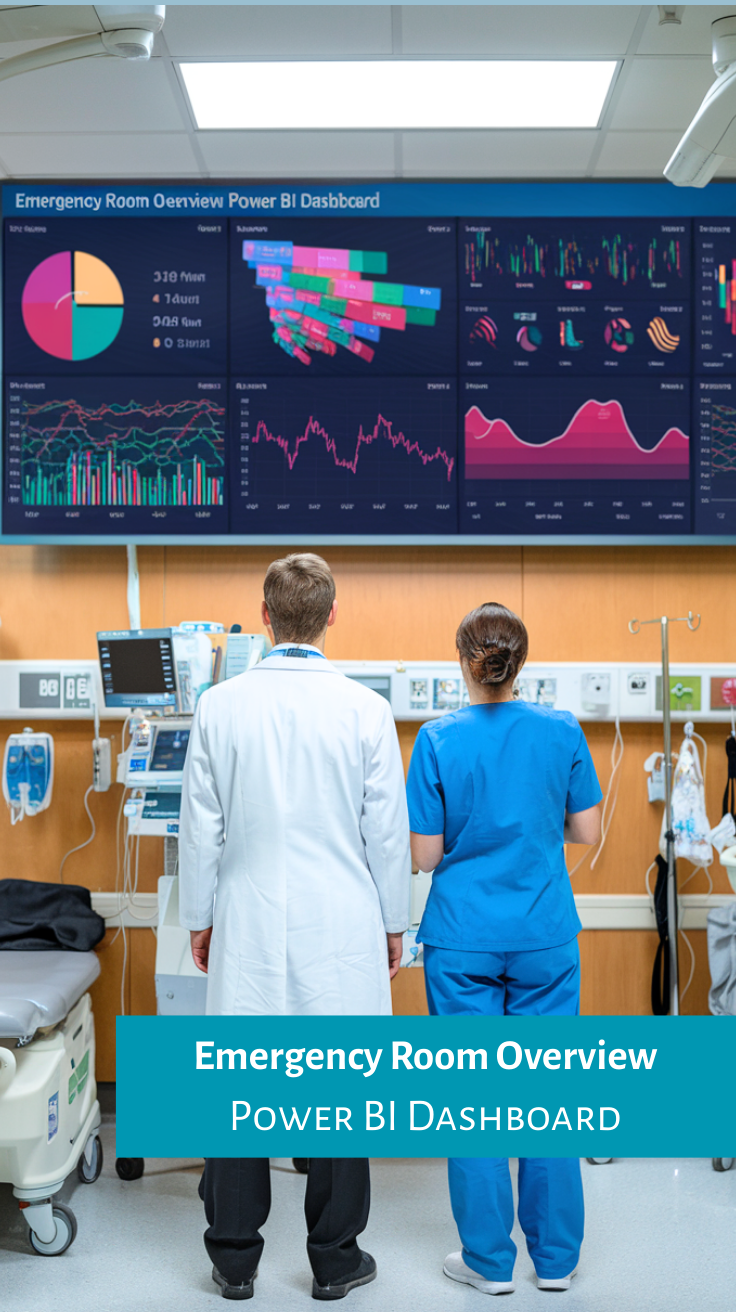
This Emergency Room Power BI dashboard is designed to streamline critical healthcare monitoring by turning complex hospital data into clear, actionable insights.
It tracks essential metrics like the total number of patients, admission rates, average waiting times, and satisfaction scores, all in one centralized platform.
By consolidating performance data, this dashboard helps hospital administrators and clinicians make faster, more informed decisions.
What Does This Dashboard Show?
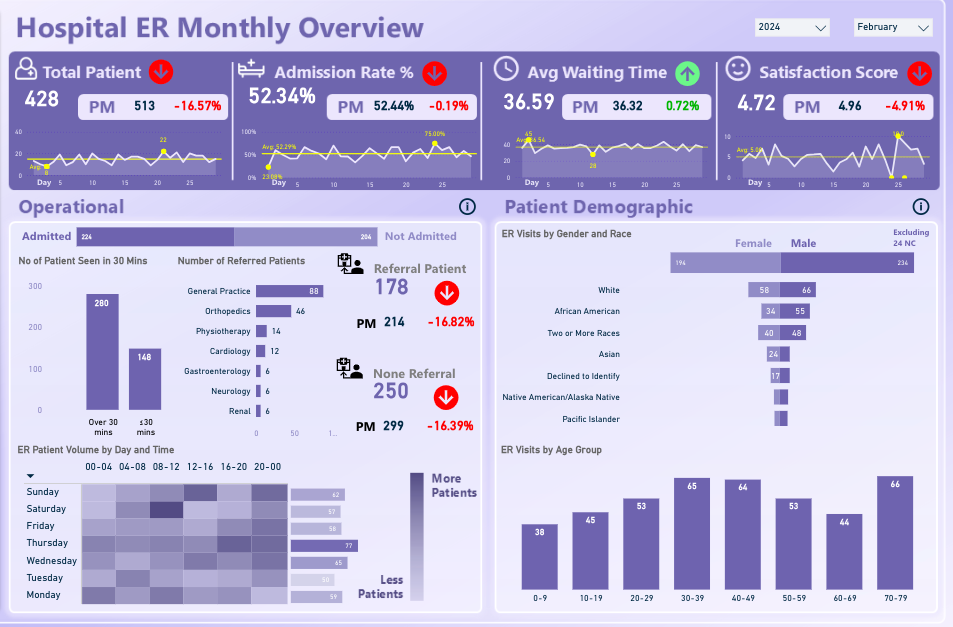
The dashboard paints a detailed picture of emergency room operations. Patient volume has declined by 16.57% compared to the previous month (PM 513), while admission rates slipped slightly by 0.19%.
More concerning is the 4.91% drop in satisfaction scores, which may point toward workflow inefficiencies or longer wait times.
It also breaks down referral patterns by department, with General Practice leading at 88 referrals, followed by Orthopedics (46) and Physiotherapy (16).
Patient flow analysis highlights efficiency challenges—260 cases exceeded 30-minute wait times, compared to 148 resolved within that window.
Demographic insights provide clarity on gender, race, and age distributions, showing peak visits among 40–49 (65 cases) and 50–59 (64 cases) age groups.
A weekly heat map further identifies busy periods, guiding hospitals in better staff scheduling and resource allocation.
Check Out Other Power BI Dashboards:
- Team Performance Dashboard
- Attendance Tracker Dashboard
- Carbon Emission Footprint Dashboard
- Player Performance Dashboard
- Procurement Dashboard
- Healthcare Analysis Dashboard
- Weather Analysis Dashboard
- Transportation & Logistics Dashboard
Uses of This Dashboard
This Emergency Room Power BI Dashboard isn’t just about displaying numbers, it’s about helping hospitals turn data into action.
By connecting operational performance with patient experiences, it supports multiple healthcare functions and decision-making areas. Some of the key uses include:
-
Emergency Department Operations Management & Workflow Optimization – By spotting inefficiencies in patient flow, the dashboard allows hospital managers to redesign workflows, cut down bottlenecks, and streamline admission processes.
-
Healthcare Quality Assurance & Patient Experience Enhancement – Tracking patient satisfaction alongside waiting times highlights gaps in service quality, helping healthcare providers deliver more patient-centered care.
-
Clinical Resource Planning & Staffing Decisions – With heat maps and patient volume trends, administrators can allocate nurses, physicians, and support staff where they are needed most, reducing burnout and improving efficiency.
-
Hospital Administration & Performance Benchmarking – Executives can use the data to benchmark current performance against past months or industry standards, ensuring the hospital stays competitive and compliant.
-
Healthcare Analytics & Regulatory Compliance Monitoring – From patient demographics to treatment timelines, the dashboard supports reporting and compliance with healthcare regulations while also aiding strategic planning.
What Do Users Like About It?
Users like the dashboard for its clean, medical-grade purple interface that highlights critical clinical performance indicators without overwhelming staff.
The heat map visualizations have been particularly well-received, offering quick insights into patient surges during peak hours.
Healthcare professionals also value the multi-dimensional demographic breakdowns, which allow them to track patient trends across age, gender, and referral patterns in real time.
Recap
The Emergency Room Power BI Dashboard demonstrates how data visualization can transform healthcare operations.
By combining patient flow analysis, demographic insights, and performance benchmarks, it gives hospitals the tools to make smarter decisions, improve patient experiences, and optimize resources.
Dashboards like this prove that data-driven healthcare is not just about numbers, it’s about saving time, enhancing care, and improving outcomes for every patient who walks through the emergency room doors.
Power BI Dashboards Worth Exploring:
- Retail Dashboard
- Airport Performance Dashboard
- Customer Analysis Dashboard
- HR Analytics Dashboard
- Inventory Insight Dashboard
- Energy Usage Dashboard
- Sales Scorecard Dashboard
- Social Media Monitoring Dashboard
Enjoyed the post?