
HR teams often juggle mountains of data, headcounts, attrition rates, satisfaction scores, performance ratings, the list goes on.
But digging through spreadsheets doesn’t exactly scream efficiency (or fun). That’s where the HR Analytics Power BI Dashboard saves the day.
It takes all those people-related numbers and serves them up in a neat, easy-to-digest format that managers and executives can actually use.
What the Dashboard Shows
This dashboard gives you a 360° view of your workforce.
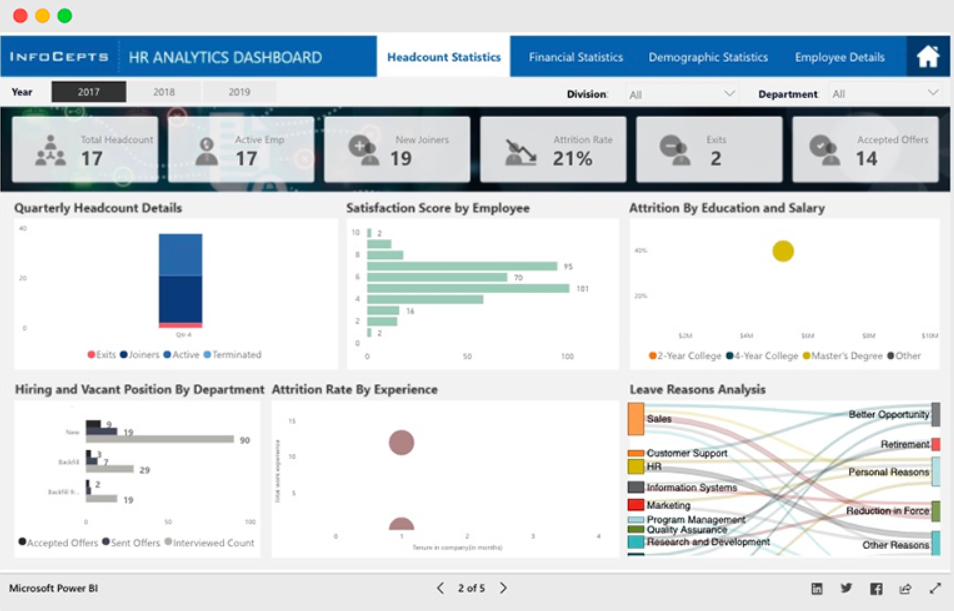
The headcount statistics tab highlights new joiners, exits, accepted offers, and attrition rates.
You can quickly see how employees are distributed by department, education, and salary, while also spotting hiring needs and vacancy trends.
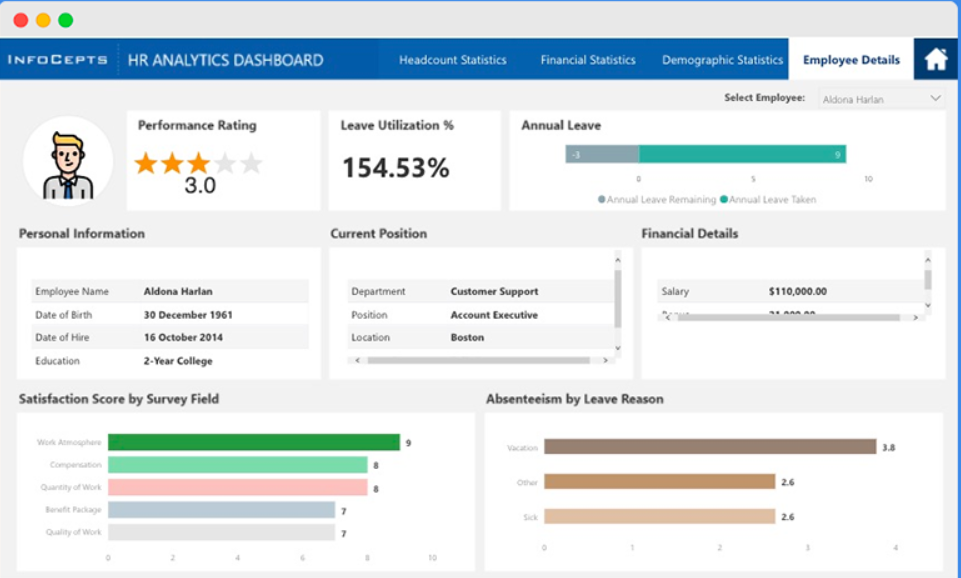
On the employee details side, the dashboard drills down to the individual level, showing performance ratings, leave utilization, salary, satisfaction scores, and even reasons for absenteeism.
It’s like having your HR reports and employee profiles stitched together into one powerful tool.
Check Out Other Power BI Dashboards:
- Team Performance Dashboard
- Attendance Tracker Dashboard
- Carbon Emission Footprint Dashboard
- Player Performance Dashboard
- Procurement Dashboard
- Healthcare Analysis Dashboard
- Weather Analysis Dashboard
- Transportation & Logistics Dashboard
Who Can Use This Dashboard
The applications are broad.
- Large corporations can use it to monitor workforce dynamics across different regions and departments.
- Startups and fast-growing companies can keep tabs on hiring, retention, and employee satisfaction as they scale.
- Healthcare, retail, and customer service industries—where turnover is often high—can use it to track attrition rates and identify trends in employee exits.
- Even government and education institutions can benefit from using it to improve workforce planning and reduce inefficiencies.
What Stands Out About It
The first thing you notice? Clarity.
The dashboard uses clean visuals, bars, charts, and simple color schemes, that make complex HR data instantly understandable.
Instead of scrolling through endless reports, you get quick answers: Why are people leaving? Which department has the highest attrition? How satisfied are employees with their work atmosphere?
The employee-level view is especially striking, it humanizes the data, giving managers a chance to spot concerns early before they become bigger issues.
Recap
The HR Analytics Power BI Dashboard isn’t just about pretty visuals, it’s about making HR smarter.
It brings together hiring, retention, performance, and employee satisfaction in one place, helping HR leaders make faster, better decisions.
And let’s be honest: anything that makes workforce data less overwhelming and more actionable is a win.
Power BI Dashboards Worth Exploring:
- Retail Dashboard
- Airport Performance Dashboard
- Customer Analysis Dashboard
- Inventory Insight Dashboard
- Energy Usage Dashboard
- Sales Scorecard Dashboard
- Social Media Monitoring Dashboard
Enjoyed the post?