Managing inventory can make or break a business’s operational efficiency, and that’s exactly where an Inventory Stock Analysis Power BI Dashboard steps in.
This dashboard consolidates large chunks of inventory data into clear, digestible visuals, helping decision-makers track stock levels, product performance, and replenishment needs at a glance.
It gives teams the power to proactively address stockouts, avoid overstocking, and ultimately improve their bottom line.
What the Dashboard Shows?
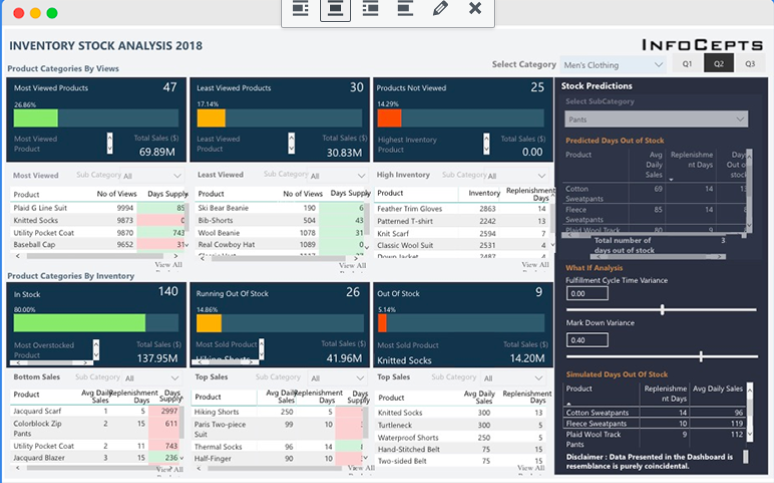
This dashboard presents a holistic view of inventory performance from multiple angles.
It highlights the most and least viewed products, their sales numbers, and days of supply. It also tracks items based on stock availability, showing what’s in stock, running out, or already out of stock, while overlaying sales data on each group.
On the right, predictive analytics forecast days out of stock based on average daily sales and replenishment schedules.
There’s also a “What If” analysis section that allows users to tweak fulfillment cycle time and markdown variance to see their impact on stock levels. Together, these elements give a clear snapshot of inventory health and sales momentum.
Check Out Other Power BI Dashboards:
- Team Performance Dashboard
- Attendance Tracker Dashboard
- Carbon Emission Footprint Dashboard
- Player Performance Dashboard
- Procurement Dashboard
- Healthcare Analysis Dashboard
- Weather Analysis Dashboard
- Transportation & Logistics Dashboard
Industries Where It Can Be Used
The ashboard can be incredibly useful across a range of industries and business verticals.
- Retail and e-commerce companies can use it to monitor fast-moving and slow-moving items.
- Apparel and fashion brands can track seasonal stock fluctuations and avoid stockouts during peak seasons.
- Manufacturers can forecast raw material requirements and manage warehouse stock efficiently.
- FMCG and consumer goods companies can use it to keep tabs on fast-turnover products.
- Even wholesale distributors and logistics firms can leverage such dashboards to maintain optimal inventory levels and minimize carrying costs.
What’s Striking About the Dashboard
What immediately stands out is how clean and structured the layout is, despite handling dense data.
The use of contrasting colors (green, red, and yellow) makes it easy to instantly identify which products are performing well, which are at risk, and which need urgent attention.
The dashboard also combines real-time data with predictive insights, enabling quick decision-making.
The side panel for simulations and “What If” analysis adds an interactive dimension, allowing users to test different scenarios without leaving the interface. Overall, it balances functionality with visual clarity perfectly.
Recap
The Inventory Stock Analysis Power BI Dashboard is a powerful tool that turns complex inventory data into clear, actionable insights.
It helps organizations monitor stock status, predict future shortages, and align replenishment strategies with sales trends.
Its visually intuitive design and predictive capabilities make it a game-changer for any business aiming to keep its inventory lean, efficient, and profitable.
Power BI Dashboards Worth Exploring:
- Retail Dashboard
- Airport Performance Dashboard
- Customer Analysis Dashboard
- HR Analytics Dashboard
- Energy Usage Dashboard
- Sales Scorecard Dashboard
- Social Media Monitoring Dashboard
Enjoyed the post?