The Player Comparison Power BI Dashboard is a dynamic tool designed for sports enthusiasts, team analysts, and coaches who want quick, data-driven insights on player performance.
By merging historical stats with customizable projections, this dashboard enables users to evaluate and compare athletes side by side with precision and clarity.
Its intuitive design makes it easy to spot strengths, weaknesses, and performance trends that can influence draft strategies or game-day decisions.
What Does this Dashboard Show?
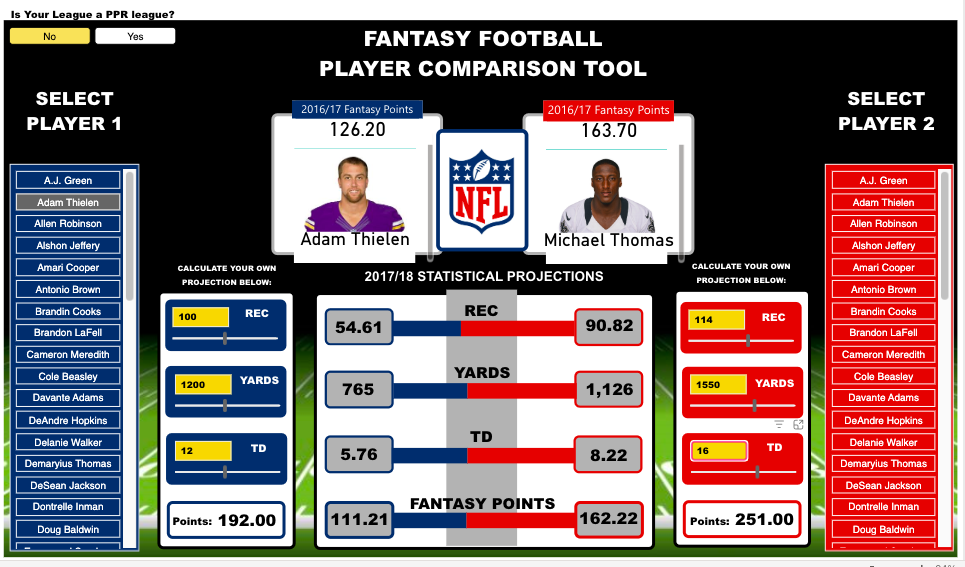
The dashboard allows users to select two players and compare their fantasy football performance across multiple metrics.
It displays past season fantasy points alongside detailed statistical categories like receptions (REC), yards, and touchdowns (TD).
Users can adjust interactive sliders to generate their own projections for the upcoming season, which are then converted into fantasy points automatically.
The visual layout presents each player’s projected stats side by side, making it simple to evaluate who might deliver a stronger performance.
Power BI Dashboards Worth Exploring:
- Retail Dashboard
- Airport Performance Dashboard
- Customer Analysis Dashboard
- HR Analytics Dashboard
- Inventory Insight Dashboard
- Energy Usage Dashboard
- Sales Scorecard Dashboard
- Social Media Monitoring Dashboard
Uses (Verticals/Functions)
-
Fantasy Team Management: Helps fantasy football players make smarter draft picks and weekly lineup decisions based on projected outcomes.
-
Performance Benchmarking: Enables coaches and analysts to compare player metrics and assess progress or decline over time.
-
Injury Impact Analysis: Allows users to simulate how changes in player availability or performance could affect overall fantasy points.
-
Scouting and Recruitment: Assists talent scouts in evaluating potential recruits by aligning their stats against current top performers.
-
Fan Engagement: Provides an interactive way for fans to explore and debate player stats during the season.
What Do Users Like About It?
The dashboard is engaging and visually balanced, which simplifies complex statistical data into easy-to-read visuals.
The side-by-side layout makes direct comparisons effortless, while the interactive sliders give users a sense of control and personalization.
The use of bold color contrasts and clean typography makes the dashboard fun to use without sacrificing clarity.
Recap
The Player Comparison Power BI Dashboard transforms raw player statistics into meaningful insights through its interactive and user-friendly interface.
It serves as a powerful tool for decision-making, whether you’re managing a fantasy league, analyzing player form, or simply exploring matchups.
It’s an engaging way to turn sports data into strategy.
Check Out Other Power BI Dashboards:
- Team Performance Dashboard
- Attendance Tracker Dashboard
- Carbon Emission Footprint Dashboard
- Procurement Dashboard
- Healthcare Analysis Dashboard
- Weather Analysis Dashboard
- Transportation & Logistics Dashboard
Enjoyed the post?