Making sense of mountains of sales data can feel like finding a needle in a haystack.
Enter the Retail Power BI Dashboard, a sleek, comprehensive analytics that transforms complex retail data into actionable insights at a glance.
It’s your retail command center that brings together sales performance, geographical insights, and profitability metrics in one unified view.
Whether you’re a retail manager trying to understand regional performance or a C-suite executive planning next quarter’s strategy, this dashboard speaks your language.
What the Dashboard Reveals
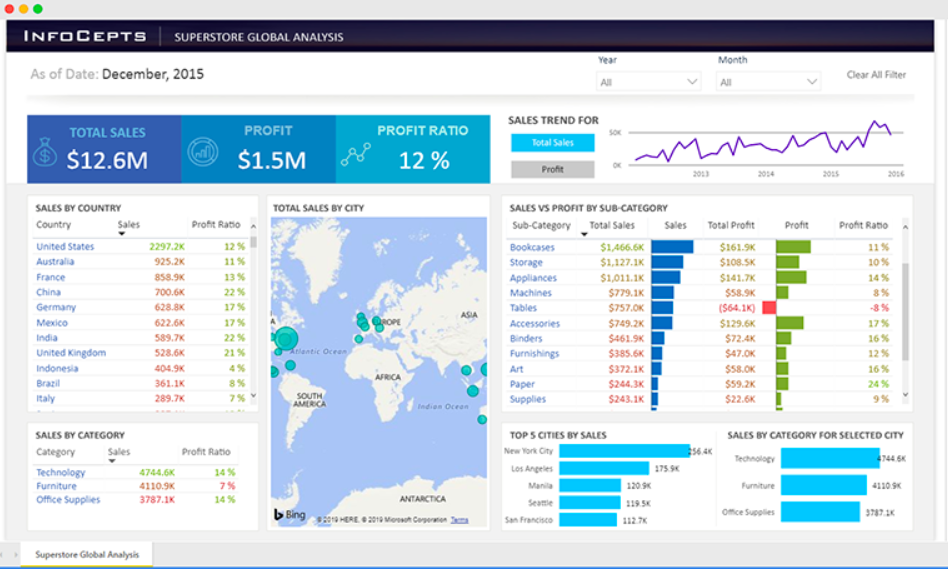
The Global Superstore dashboard is a treasure trove of retail intelligence, presenting a 360-degree view of business performance.
With data on total sales and profit, the dashboard immediately communicates the health of the business.
The geographic visualization takes center stage, mapping sales performance across continents with intuitive bubble charts that make global trends instantly recognizable.
You can drill down from country-level performance to city-specific insights.
Product category analysis breaks down performance across Technology, Furniture, and Office Supplies, while sub-category insights reveal which specific product lines are driving profitability.
The dashboard also captures temporal trends, showing sales evolution over multiple years, helping identify seasonal patterns and growth trajectories.
Check Out Other Power BI Dashboards:
- Team Performance Dashboard
- Attendance Tracker Dashboard
- Carbon Emission Footprint Dashboard
- Player Performance Dashboard
- Procurement Dashboard
- Healthcare Analysis Dashboard
- Weather Analysis Dashboard
- Transportation & Logistics Dashboard
Industries and Verticals That Can Leverage This Dashboard
- E-commerce and Online Retail
- Consumer Electronics
- Fashion and Apparel
- Food and Beverage
What Makes This Dashboard Stand Out
- Intuitive Color Coding: Blue and green palette creates clear visual hierarchy without overwhelming the user
- Geographic Intelligence: Interactive world map makes global performance immediately understandable
- Balanced Layout: Well-proportioned sections prevent information overload
- Multi-dimensional Analysis: Seamlessly combines geographic, temporal, and categorical data views
- Clear Typography: Easy-to-read fonts and appropriate sizing enhance data comprehension
- Logical Information Flow: Data is organized in a natural reading pattern from summary to details
Wrapping Up
The Global Superstore Retail Power BI Dashboard exemplifies how modern analytics should work.
By combining geographical intelligence, category performance, and trend analysis in one cohesive view, it empowers retail professionals to make informed decisions quickly.
Ready to transform your retail analytics? Sometimes the best insights are just one dashboard away.
Power BI Dashboards Worth Exploring:
- Airport Performance Dashboard
- Customer Analysis Dashboard
- HR Analytics Dashboard
- Inventory Insight Dashboard
- Energy Usage Dashboard
- Sales Scorecard Dashboard
- Social Media Monitoring Dashboard
Enjoyed the post?