
The Revenue & Profitability Power BI Dashboard transforms complex financial data into actionable insights.
It serves as a central hub for monitoring organizational fiscal health and driving strategic decision-making.
Dashboard Overview
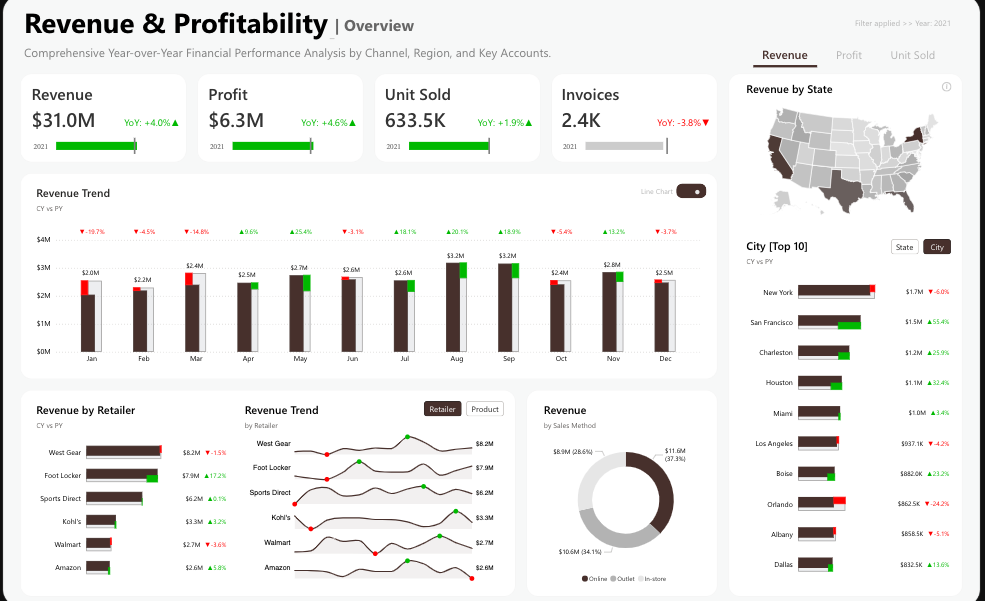
This comprehensive financial analytics platform consolidates revenue streams, profit margins, and sales data to provide stakeholders with immediate access to critical business performance indicators.
Current performance metrics showcase strong organizational growth: revenue increased 4.0% year-over-year to $31.0M, with profit margins expanding 4.6% to $6.3M.
Unit sales grew 1.9% to 633.5K, while the 3.8% decline in invoices to 2.4K indicates a strategic shift toward higher-value transactions.
The dashboard reveals monthly revenue trends with detailed seasonal patterns, retailer performance analysis led by West Gear ($6.2M), Foot Locker ($7.8M), and Sports Direct ($6.2M).
It also shows geographical insights highlighting top-performing cities like New York, San Francisco, and Charleston.
Check Out Other Power BI Dashboards:
- Team Performance Dashboard
- Attendance Tracker Dashboard
- Carbon Emission Footprint Dashboard
- Player Performance Dashboard
- Procurement Dashboard
- Healthcare Analysis Dashboard
- Weather Analysis Dashboard
- Transportation & Logistics Dashboard
Key Applications
Corporate Financial Management – Enables real-time profitability monitoring and strategic financial reporting for executive teams and board presentations.
Multi-Channel Retail Analytics – Optimizes retail partnerships by identifying high-performing channels and allocating marketing resources effectively across partners like Kohl’s, Walmart, and Amazon.
Geographic Market Analysis – Supports expansion planning through state-level and city-level revenue mapping, helping identify untapped markets and optimize regional strategies.
Revenue Forecasting – Provides historical trend data for building predictive models and creating accurate business forecasts.
User Experience
- Modern Dark Interface – Features a sophisticated design that reduces eye strain while maintaining professional aesthetics and intuitive color coding for trend analysis.
- Geographic Heat Mapping – Transforms complex geographical data into visual insights, enabling quick identification of high-performing regions and expansion opportunities.
- Multi-Dimensional Analysis – Offers both macro-level organizational trends and micro-level retailer-specific insights, providing flexibility for strategic oversight and tactical account management.
Conclusion
The Revenue & Profitability Power BI Dashboard exemplifies modern business intelligence, consolidating multiple data streams into an intuitive interface that empowers proactive financial management.
Its combination of comprehensive metrics, thoughtful design, and multi-dimensional analysis makes it an invaluable tool for data-driven organizations seeking to move beyond reactive reporting toward strategic decision-making.
Power BI Dashboards Worth Exploring:
- Retail Dashboard
- Airport Performance Dashboard
- Customer Analysis Dashboard
- HR Analytics Dashboard
- Inventory Insight Dashboard
- Energy Usage Dashboard
- Sales Scorecard Dashboard
- Social Media Monitoring Dashboard
Enjoyed the post?