
This Sales Scorecard Power BI Dashboard gives a clear and structured view of overall sales performance while zeroing in on areas where the business is losing money.
It organizes sales figures by product, state, and region, allowing teams to quickly identify which categories are generating revenue and which are draining profitability.
The dashboard also flags unprofitable items and highlights the responsible sales reps across different regions, bringing accountability into the picture.
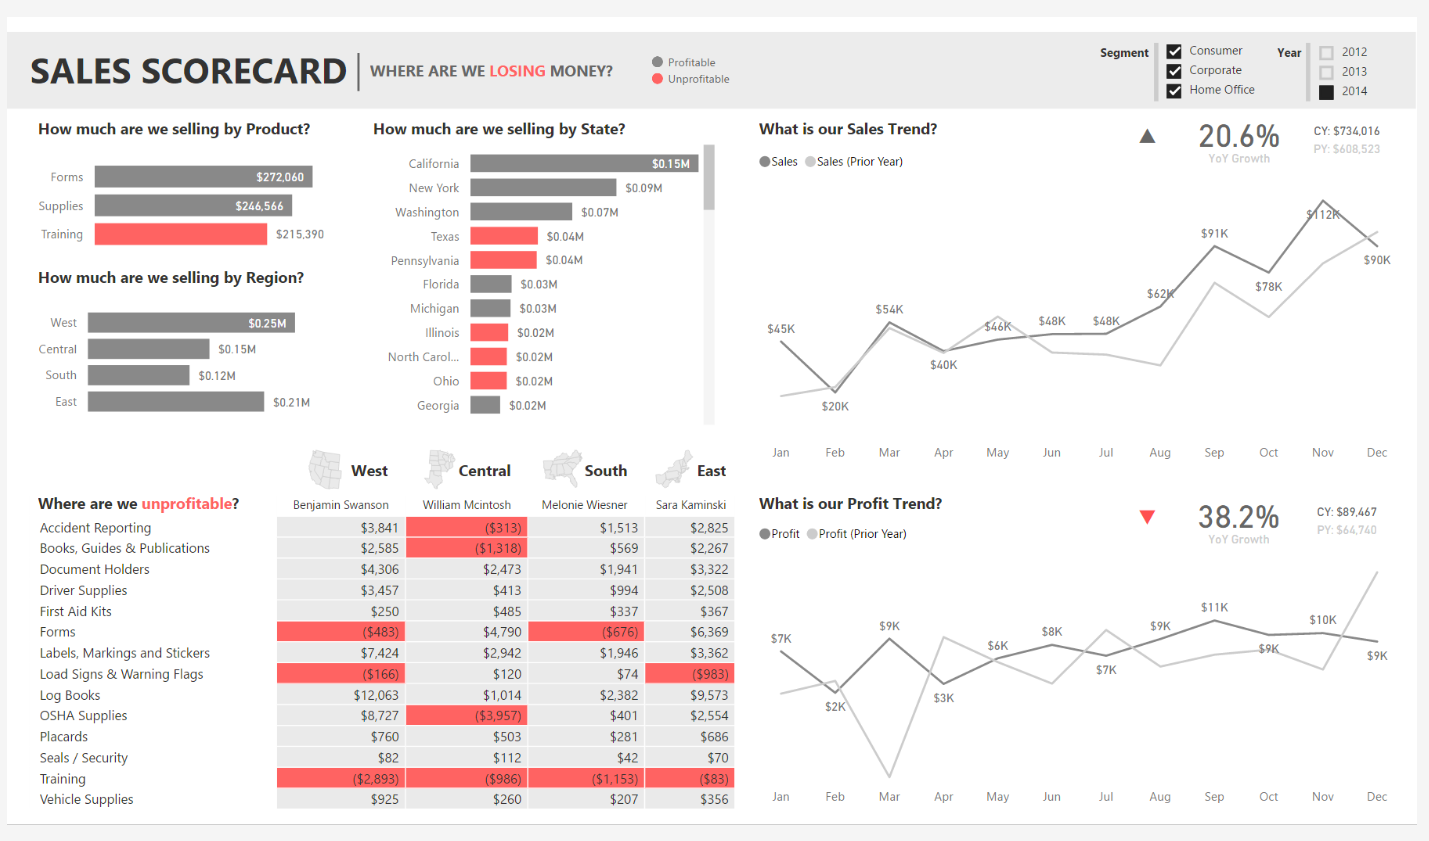
A side-by-side trend analysis shows how both sales and profit have evolved over the year, providing visibility into growth patterns and dips compared to prior periods.
Users can see YoY growth percentages for both revenue and profit, making it easy to assess the financial health of the company at a glance.
The color-coded indicators for profitable and unprofitable products enhance decision-making by directing focus to problem areas instantly.
Check Out Other Power BI Dashboards:
- Team Performance Dashboard
- Attendance Tracker Dashboard
- Carbon Emission Footprint Dashboard
- Player Performance Dashboard
- Procurement Dashboard
- Healthcare Analysis Dashboard
- Weather Analysis Dashboard
- Transportation & Logistics Dashboard
Key Insights
-
Breaks down sales by product category, state, and region for granular visibility
-
Identifies unprofitable products and links them to specific sales reps
-
Tracks sales and profit YoY growth with intuitive trend lines
-
Color-coded metrics make it easy to distinguish profitable vs. unprofitable segments
-
Offers both current and prior year performance for context
Practical Applications
-
Sales Management: Monitor team and regional performance to adjust targets
-
Financial Planning: Identify revenue leakages to improve profitability
-
Product Strategy: Focus on high-performing products while reviewing underperforming ones
-
Executive Reporting: Present concise performance summaries to stakeholders
-
Forecasting: Spot growth trends to plan future sales campaigns
Quick Recap
This dashboard is an all-in-one tool to understand where revenue is growing and where profits are slipping.
By tying performance to regions, products, and sales reps, it delivers actionable intelligence that helps drive smarter business decisions.
Power BI Dashboards Worth Exploring:
- Retail Dashboard
- Airport Performance Dashboard
- Customer Analysis Dashboard
- HR Analytics Dashboard
- Inventory Insight Dashboard
- Energy Usage Dashboard
- Social Media Monitoring Dashboard
Enjoyed the post?