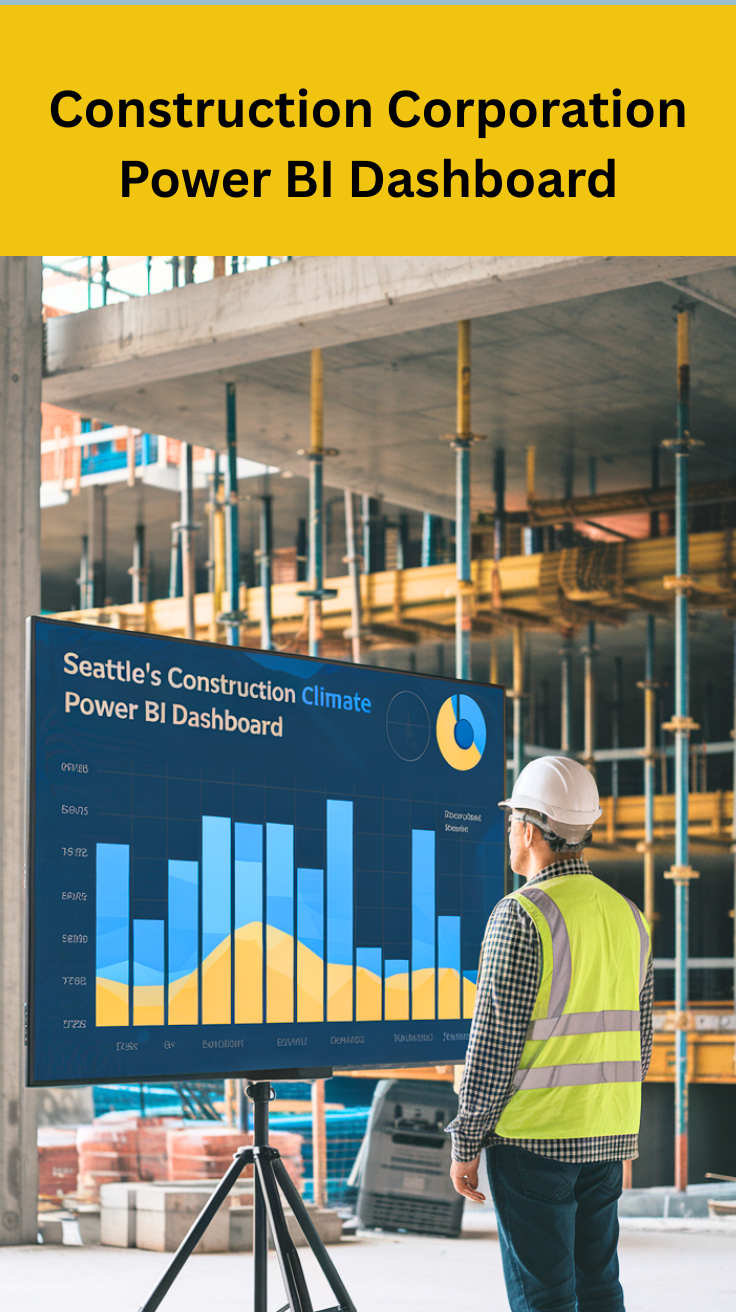
This Seattle’s Construction Climate Power BI Dashboard transforms complex building permit data into clear, actionable business intelligence.
This powerful tool harnesses Seattle’s Building Permits dataset to reveal current market conditions and future construction trends.
What Does This Dashboard Show?
The dashboard features three strategic tabs designed to answer critical business questions:
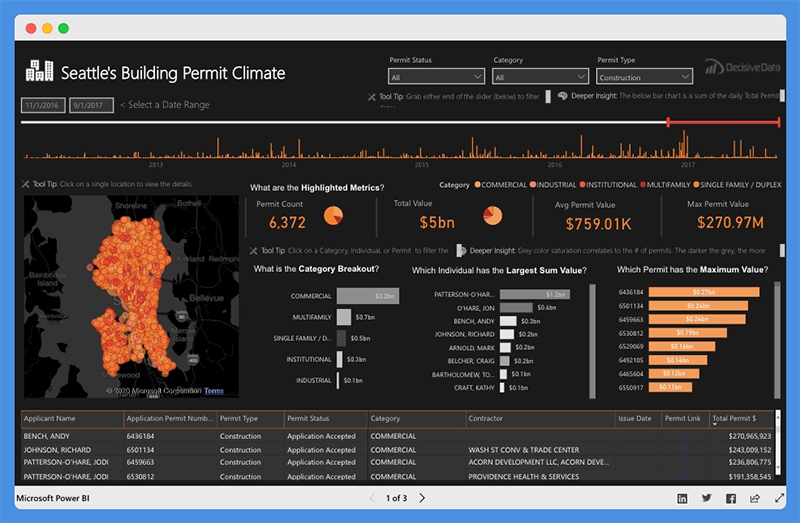
Building Climate Overview Tab
It serves as your market command center, displaying investment trends over time through interactive bar charts and geographic hotspot mapping.
Key metrics include permit counts, total values, and average permit values, while bar charts reveal leading categories and top market performers.
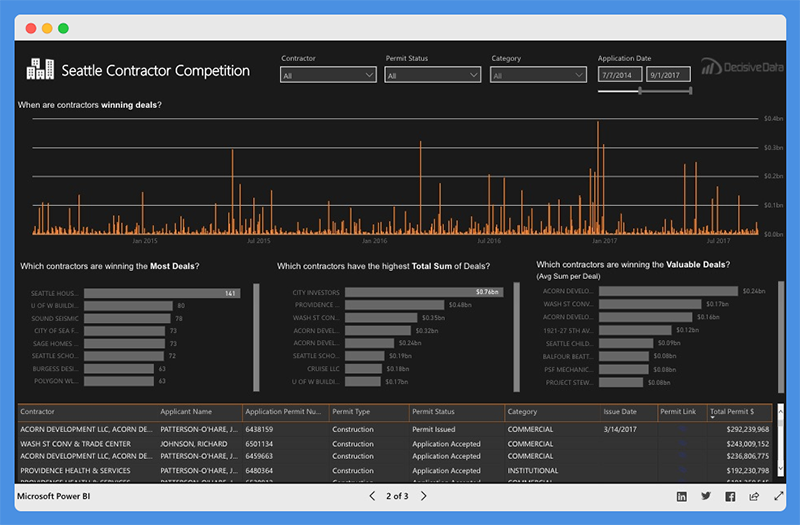
Contractor Competition Tab
The tab provides competitive intelligence with line charts showing deal trends and frequencies.
Bar charts identify which contractors are winning the most deals and commanding the highest contract values across different market segments.
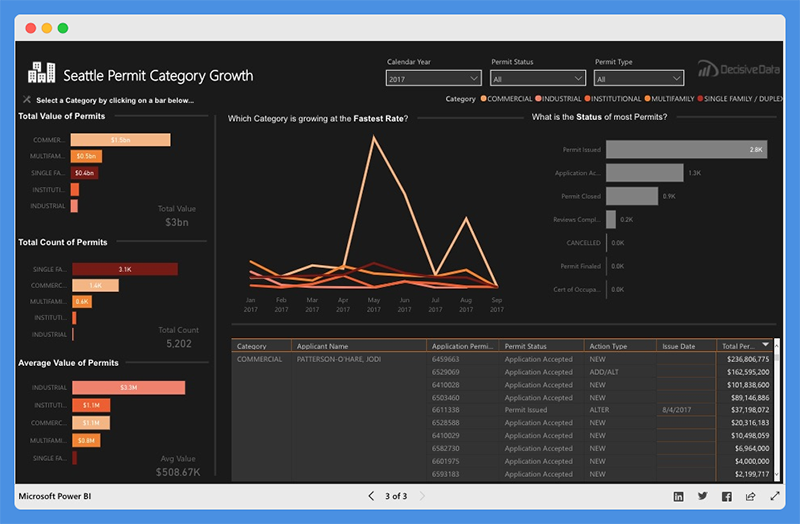
Category Growth Tab
The tab offers sector-specific insights comparing permit values, counts, and averages across construction categories.
Line charts reveal which sectors are growing fastest, while status charts show permit pipeline health.
Check Out Other Power BI Dashboards:
- Team Performance Dashboard
- Attendance Tracker Dashboard
- Carbon Emission Footprint Dashboard
- Player Performance Dashboard
- Procurement Dashboard
- Healthcare Analysis Dashboard
- Weather Analysis Dashboard
- Transportation & Logistics Dashboard
Key Applications
- Construction Sales Teams use the dashboard to identify emerging development hotspots, track competitor activities, and optimize territory planning. The geographic mapping and permit value trends help prioritize high-potential prospects and time market entry strategies.
- Contractors gain competitive intelligence to analyze competitor patterns, identify market leaders, and discover underserved segments. The permit status tracking helps with project timeline planning and resource allocation.
- Executive Leadership accesses comprehensive market intelligence for strategic decision-making, identifying expansion opportunities, assessing market saturation, and timing strategic initiatives based on investment concentration patterns.
User Experience
The dashboard excels in usability with powerful filtering options including permit status, permit type, construction category, and contractor-specific views.
Users can customize timeframes and parameters to match their specific analytical needs.
Final Thoughts
The dashboard eliminates the complexity barrier between raw data and actionable insights.
The intuitive design enables quick identification of trends and opportunities without requiring data analysis expertise. Users appreciate the visual clarity that supports confident, rapid decision-making.
Seattle’s Construction Climate Power BI Dashboard democratizes sophisticated market intelligence, giving construction professionals the strategic advantage they need to succeed in Seattle’s dynamic market.
Power BI Dashboards Worth Exploring:
- Retail Dashboard
- Airport Performance Dashboard
- Customer Analysis Dashboard
- HR Analytics Dashboard
- Inventory Insight Dashboard
- Energy Usage Dashboard
- Sales Scorecard Dashboard
- Social Media Monitoring Dashboard
Enjoyed the post?