
The Sustainability Review Power BI dashboard helps organizations track and manage their environmental impact with clarity and precision.
With a consolidated data on emissions, energy consumption, water usage, and waste management, it provides a holistic view of sustainability performance across ongoing projects.
This supports companies in meeting compliance standards while driving progress toward long-term ESG (Environmental, Social, and Governance) goals.
What Does This Dashboard Show?
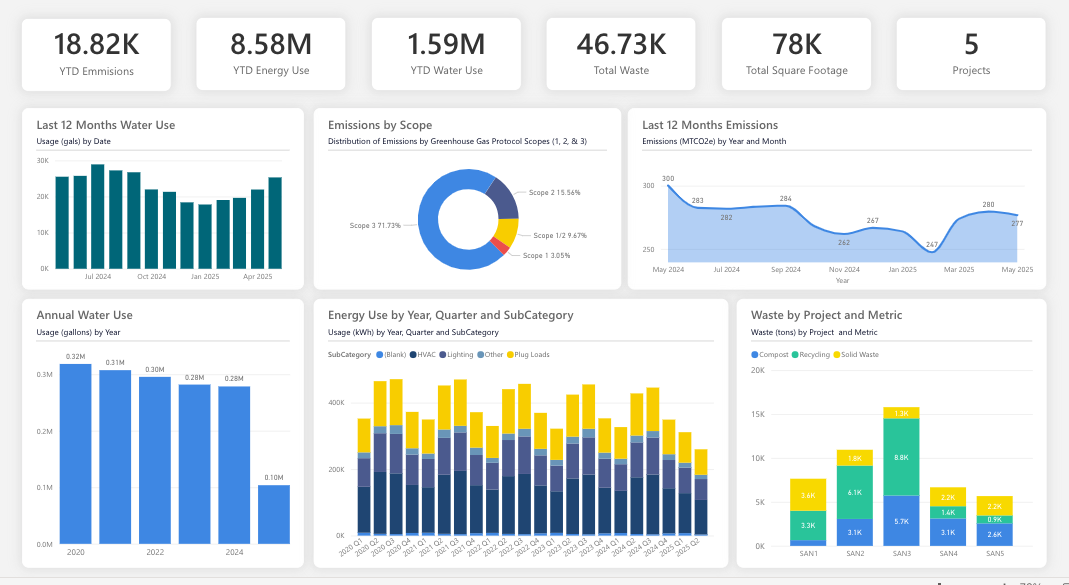
The dashboard presents emissions data categorized according to GHG Protocol standards, with Scope 2 emissions accounting for 58.4%, followed by Scope 3 (29.7%) and Scope 1 (3.05%).
The breakdown helps organizations identify where most emissions are generated and where reduction efforts should be prioritized.
Water usage insights show monthly consumption patterns with seasonal variations, while long-term data highlights a positive downward trend—from a peak of 2.32M gallons in 2020 to a projected 1.70M gallons in 2024.
Energy consumption is segmented by quarters and categories such as Steam, HVAC, Lighting, and Plug Loads, enabling a detailed understanding of resource utilization.
Waste tracking distinguishes between Compost, Recycling, and Solid Waste, giving visibility into sustainability efforts across different project phases.
Together, these visualizations provide a comprehensive snapshot of how organizations manage resources and reduce their environmental footprint.
Check Out Other Power BI Dashboards:
- Team Performance Dashboard
- Attendance Tracker Dashboard
- Carbon Emission Footprint Dashboard
- Player Performance Dashboard
- Procurement Dashboard
- Healthcare Analysis Dashboard
- Weather Analysis Dashboard
- Transportation & Logistics Dashboard
Uses of This Dashboard
The Sustainability Review Dashboard serves as a versatile tool across industries committed to greener operations.
The dashboard can be used for:
-
Corporate Environmental Compliance & ESG Reporting – Businesses can align with global reporting frameworks and transparently communicate their environmental impact to stakeholders and investors.
-
Facilities Management & Green Building Operations – Facilities teams can monitor energy and water consumption across buildings to implement efficiency upgrades and reduce overhead costs.
-
Sustainability Program Monitoring & Carbon Footprint Reduction – Organizations can set benchmarks, track progress toward emissions reduction targets, and optimize resource usage over time.
-
Energy Efficiency Optimization & Resource Management – By breaking down energy usage by systems, companies can identify inefficiencies, reduce waste, and lower operational costs.
-
Environmental Impact Assessment & Regulatory Adherence – The dashboard ensures compliance with environmental regulations while providing data-driven insights for future sustainability planning.
What Do User Like About It?
- Clean, environmentally inspired theme
- Scope-based emission categorization with donut visualizations
- Integration of multi-timeline analysis
The dashboard has been recognized as both a compliance tool and a strategic asset, bridging regulatory requirements with long-term sustainability goals.
Final Thoughts
The Sustainability Review Dashboard demonstrates how Power BI can turn environmental data into a powerful driver of change.
By offering visibility into emissions, resource consumption, and waste management, it empowers organizations to track progress, reduce their footprint, and operate more responsibly.
In an era where sustainability is no longer optional but essential, dashboards like this ensure that businesses remain accountable while moving toward a greener future.
Power BI Dashboards Worth Exploring:
- Retail Dashboard
- Airport Performance Dashboard
- Customer Analysis Dashboard
- HR Analytics Dashboard
- Inventory Insight Dashboard
- Energy Usage Dashboard
- Sales Scorecard Dashboard
- Social Media Monitoring Dashboard
Enjoyed the post?