The Transportation & Logistics Analysis Power BI dashboard is designed to provide full visibility into logistics and delivery operations.
It goes beyond tracking shipments by combining booking volumes, delivery performance, and driver activity into a single interface.
With its ability to monitor on-time deliveries, delays, trip distances, and lead times, this dashboard gives logistics managers the insights they need to streamline supply chains and improve customer satisfaction.
What Does This Dashboard Show?
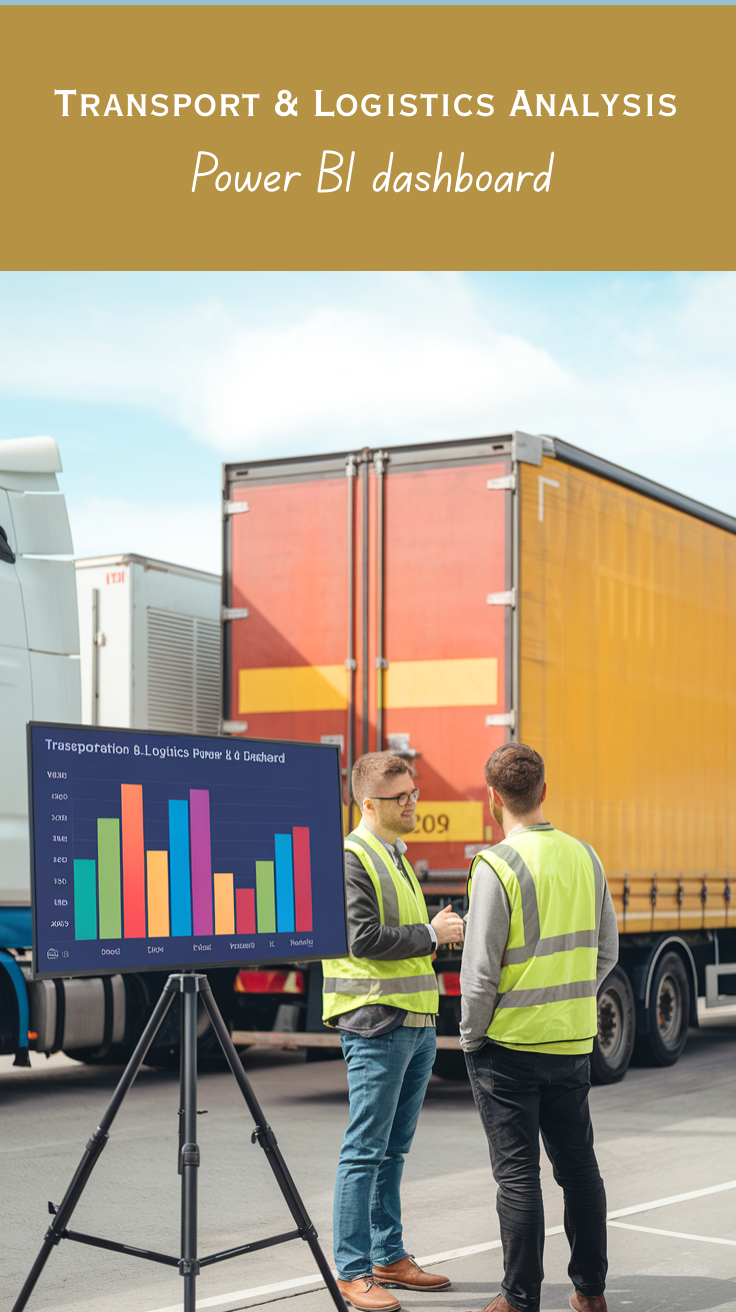
![]()
This dashboard highlights logistics performance across multiple dimensions.
Monthly trajectory analysis shows steady growth in bookings, starting from January’s baseline and peaking in August, reflecting seasonal demand trends.
Daily booking comparisons reveal weekday dominance with 2,202 average bookings compared to only 277 on weekends.
Route distribution shows a strong tilt toward intra-city shipments (54%), while inter-city routes account for 76% of long-haul operations.
Hourly patterns highlight afternoon peaks, while weekday heat maps reveal Tuesday and Wednesday as the busiest days.
Additionally, the dashboard provides driver performance rankings and detailed destination analyses, making it easier to track efficiency and identify improvement areas.
Check Out Other Power BI Dashboards:
- Team Performance Dashboard
- Attendance Tracker Dashboard
- Carbon Emission Footprint Dashboard
- Player Performance Dashboard
- Procurement Dashboard
- Healthcare Analysis Dashboard
- Weather Analysis Dashboard
- Delivery App Sales Dashboard
Uses of This Dashboard
This dashboard has wide-ranging applications across transportation and supply chain management.
By consolidating booking, route, and performance data, it helps businesses enhance operations and customer service. Key uses include:
-
Fleet Management & Transportation Operations – Managers can monitor vehicle utilization, delivery timelines, and shipment volumes to ensure fleets are operating efficiently and reliably.
-
Last-Mile Delivery Optimization & Route Planning – By analyzing route preferences and traffic patterns, logistics teams can design faster, cost-effective last-mile delivery strategies.
-
Logistics Performance Analytics & Driver Management – The dashboard’s driver ranking system allows managers to recognize high performers and provide targeted training for underperforming drivers.
-
Supply Chain Visibility & Customer Service Enhancement – Real-time tracking of bookings and delivery performance helps businesses stay transparent with clients, improving trust and customer satisfaction.
-
Transportation Cost Analysis & Operational Efficiency – Insights into trip distances, lead times, and delivery delays allow companies to identify inefficiencies and reduce operational costs.
What Do Users Like About It?
- Dynamic purple-themed interface, enhanced with logistics-specific iconography that makes data interpretation intuitive.
- The heat map integration has been especially praised for simplifying time-based booking and delivery patterns, making it easy to identify demand surges.
- The combination of circular progress indicators with detailed analytics tables has also been well received, as it balances quick-glance metrics with deeper operational detail.
Recap
The Transportation & Logistics Analysis Dashboard demonstrates the power of Power BI in simplifying complex supply chain data.
By combining booking patterns, delivery metrics, driver performance, and cost analysis, it enables logistics professionals to optimize operations end-to-end.
More than just a reporting tool, it acts as a decision-support system—helping businesses deliver on time, reduce costs, and stay competitive in a fast-moving logistics landscape.
Power BI Dashboards Worth Exploring:
- Retail Dashboard
- Airport Performance Dashboard
- Customer Analysis Dashboard
- HR Analytics Dashboard
- Inventory Insight Dashboard
- Energy Usage Dashboard
- Sales Scorecard Dashboard
- Social Media Monitoring Dashboard
Enjoyed the post?