
The Carbon Emission Footprint Power BI Dashboard is designed to provide organizations and policymakers with an accurate, comprehensive view of carbon dioxide emissions over time.
By leveraging the GHG Protocol framework, it brings clarity to complex sustainability data, enabling users to make informed decisions that align with climate goals.
The dashboard simplifies emission tracking across direct, indirect, and value chain activities, making it an indispensable tool for businesses and governments aiming to meet their carbon reduction commitments.
What Does this Dashboard Show?
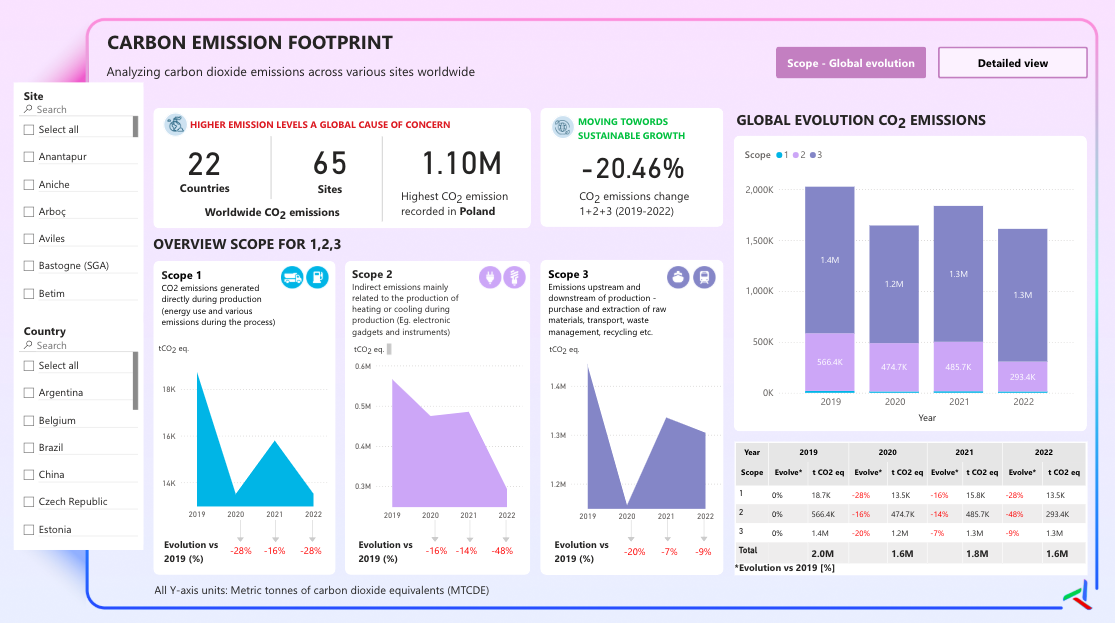
This dashboard categorizes emissions into three widely recognized scopes: Scope 1 (direct emissions from company-owned sources), Scope 2 (indirect emissions from purchased electricity and energy), and Scope 3 (other indirect emissions across the value chain).
Visual trend lines from 2019 to 2022 highlight an encouraging -20.46% reduction in overall emissions.
It combines high-level KPIs with detailed analysis, presenting both year-over-year percentage shifts and absolute values in metric tonnes of CO2 equivalents (MTCDE).
Users can also compare performance across regions and time periods, making it a practical tool for both macro and micro-level emission tracking.
Power BI Dashboards Worth Exploring:
- Retail Dashboard
- Airport Performance Dashboard
- Customer Analysis Dashboard
- HR Analytics Dashboard
- Inventory Insight Dashboard
- Energy Usage Dashboard
- Sales Scorecard Dashboard
- Social Media Monitoring Dashboard
Uses of This Dashboard
-
Corporate Sustainability Reporting: Companies can use it to meet disclosure requirements and showcase their commitment to ESG goals.
-
Government and Policy Making: Public agencies can assess regional and sector-based emission reductions to guide policy development.
-
Supply Chain Management: Businesses gain visibility into Scope 3 emissions, helping them work with suppliers to minimize environmental impact.
-
Investment and Finance: Investors can evaluate carbon risk and make data-driven decisions by analyzing an organization’s emission trajectory.
What Users Think?
The sophisticated use of color psychology, communicates seriousness while remaining visually engaging.
The scope-based layout provides a clear, logical flow for understanding emissions data without overwhelming viewers.
Its balanced information density ensures stakeholders can quickly absorb high-level insights while still having access to granular details.
Overall, the dashboard is both practical and persuasive, making sustainability reporting more transparent and impactful.
Check Out Other Power BI Dashboards:
- Team Performance Dashboard
- Attendance Tracker Dashboard
- Player Performance Dashboard
- Procurement Dashboard
- Healthcare Analysis Dashboard
- Weather Analysis Dashboard
- Transportation & Logistics Dashboard
Enjoyed the post?