
The Superstore Performance Power BI dashboard is an executive-level tool designed to provide leaders with critical business intelligence.
It visualizes key performance indicators like gross sales year-to-date and gross profit, which offers a clear picture of overall performance while breaking down insights across product categories, customer loyalty, and operational efficiency.
This makes it a valuable resource for retail chains and enterprises managing multiple locations and revenue streams.
What Does This Dashboard Show?
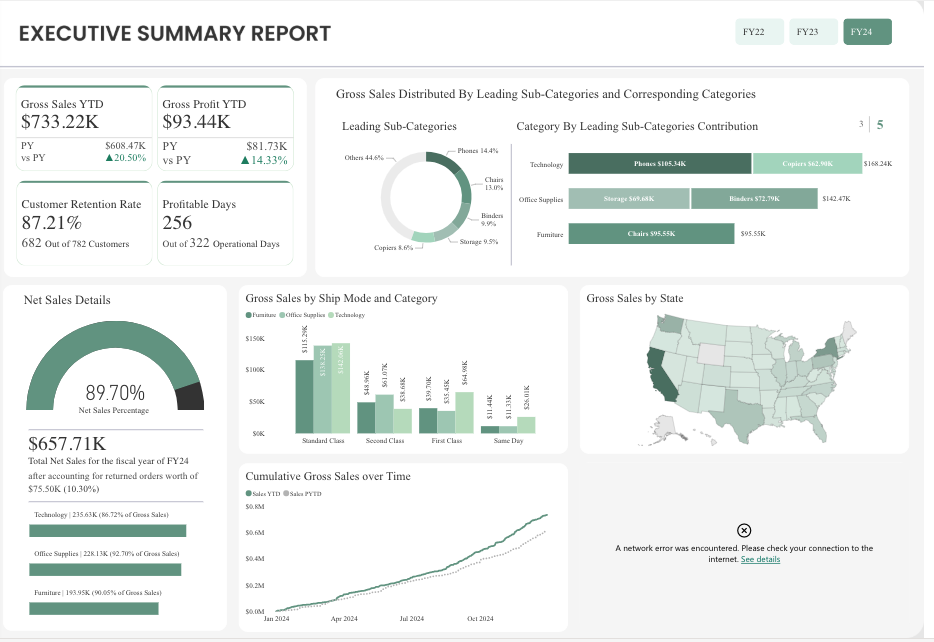
This dashboard highlights customer retention strength, showing an impressive 87.21% retention rate, with 682 out of 782 customers returning.
It also tracks operational consistency, recording 256 profitable days throughout the year.
Sales are broken down across sub-categories, with Technology leading in market share, followed by Office Supplies and Furniture, giving executives a clear view of where the highest growth opportunities lie.
A US geographic heat map provides state-by-state revenue concentration, enabling regional performance analysis.
The dashboard also monitors shipping methodology effectiveness across different service levels, including Standard Class, Second Class, First Class, and Same Day deliveries.
Finally, it visualizes cumulative gross sales growth throughout FY24, showing consistent upward trends from January through October 2024—an encouraging sign for long-term stability.
Power BI Dashboards Worth Exploring:
- Retail Dashboard
- Airport Performance Dashboard
- Customer Analysis Dashboard
- HR Analytics Dashboard
- Inventory Insight Dashboard
- Energy Usage Dashboard
- Sales Scorecard Dashboard
- Social Media Monitoring Dashboard
Uses of This Dashboard
The Superstore Performance Dashboard goes beyond reporting to serve as a strategic decision-making tool across different functions of the business.
Its versatility supports executive teams, retail managers, and financial planners. Some of its key uses include:
-
C-Suite Strategic Decision Making & Board Reporting – Executives can leverage KPI visualizations to guide strategic initiatives, improve investor presentations, and communicate performance with clarity.
-
Multi-Location Retail Chain Performance Assessment – With geographic breakdowns, leaders can evaluate which states or regions are driving revenue and where additional investment may be required.
-
Customer Lifecycle Management & Retention Analysis – The retention rate metric highlights loyalty trends, helping businesses design strategies to engage and retain valuable customers.
-
Supply Chain & Logistics Optimization – By analyzing shipping methodologies, managers can identify cost-saving opportunities and improve delivery times without compromising service quality.
-
Financial Planning & Annual Performance Reviews – The consistent upward sales trajectory provides valuable insights for forecasting, budget planning, and year-end reviews.
Users’ Feedback
Users like the dashboard’s executive-grade minimalist design, which focuses on high-priority KPIs without overwhelming the viewer with excessive details.
The use of gauge charts and geographic heat maps presents complex data in an accessible and visually compelling way.
Its sophisticated color palette reinforces professional credibility, making it ideal for boardroom discussions and strategic reporting.
Conclusion
The Superstore Performance Dashboard showcases the value of Power BI in retail and enterprise-level operations.
By uniting customer retention data, geographic performance, sales trajectories, and logistics insights into one cohesive platform, it enables smarter business planning and more agile decision-making.
Dashboards like this provide the clarity and foresight executives need to sustain growth and enhance profitability.
Check Out Other Power BI Dashboards:
- Team Performance Dashboard
- Attendance Tracker Dashboard
- Carbon Emission Footprint Dashboard
- Player Performance Dashboard
- Procurement Dashboard
- Healthcare Analysis Dashboard
- Weather Analysis Dashboard
- Transportation & Logistics Dashboard
Enjoyed the post?