
The Weather Analysis Power BI dashboard provides real-time meteorological insights by visualizing atmospheric conditions in a simple, easy-to-read format.
It goes beyond basic temperature readings by including multi-city comparisons and environmental factors like humidity, wind velocity, and air quality.
The dashboard allows users, from policymakers to everyday citizens, to make decisions based on accurate, data-driven weather updates.
What Does This Dashboard Show?
The dashboard integrates several weather metrics into one interactive interface.
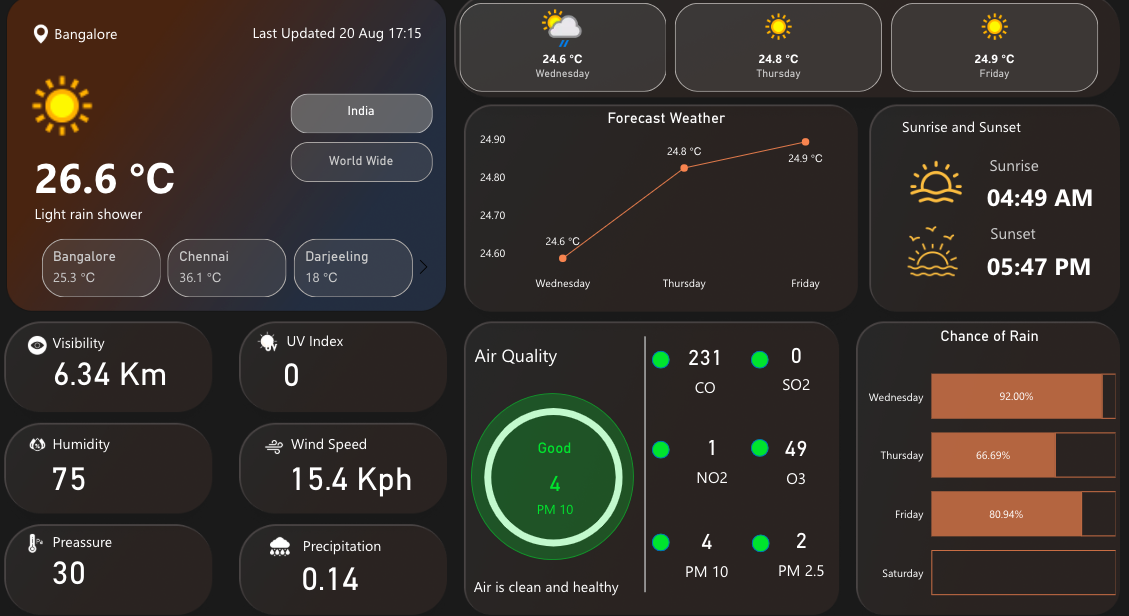
Air quality is tracked with a circular gauge showing a “Good” rating at PM10 level 4, accompanied by pollutant data such as CO (231), SO₂ (0), NO₂ (1), O₃ (49), PM10 (4), and PM2.5 (2).
It also provides three-day weather forecasts, showing temperature shifts from 24.6°C to 24.9°C, along with precise sunrise (04:49 AM) and sunset (05:47 PM) timings.
Precipitation analysis highlights changing rain probabilities, declining from a high 92% chance on Wednesday to minimal chances by Saturday.
Together, these insights give a full view of local and regional weather conditions.
Power BI Dashboards Worth Exploring:
- Retail Dashboard
- Airport Performance Dashboard
- Customer Analysis Dashboard
- HR Analytics Dashboard
- Inventory Insight Dashboard
- Energy Usage Dashboard
- Sales Scorecard Dashboard
- Social Media Monitoring Dashboard
Uses of This Dashboard
This Weather Analysis Dashboard has applications across multiple industries and everyday activities. By combining forecasting, air quality monitoring, and environmental metrics, it enables smarter decision-making.
The key uses include:
-
Agricultural Planning & Crop Management Systems – Farmers and agricultural planners can use rainfall forecasts and humidity levels to optimize irrigation schedules, reduce crop losses, and plan harvests more effectively.
-
Aviation & Transportation Weather Intelligence – Airlines, logistics companies, and transportation agencies rely on real-time weather conditions and wind velocity data to plan safer and more efficient routes.
-
Event Management & Outdoor Activity Planning – Organizers can schedule outdoor events by monitoring precipitation chances and temperature forecasts, minimizing disruption from unexpected weather changes.
-
Environmental Health Monitoring & Public Safety – With pollutant breakdowns and air quality indicators, public health authorities can issue warnings for vulnerable populations and develop safety protocols.
-
Tourism & Hospitality Weather Advisory Services – Hotels, resorts, and travel agencies can use weather forecasts to enhance guest experiences, offering timely advice on outdoor activities and excursions.
What Do Users Like About It?
Users like the dashboard’s sleek dark theme, which uses color coding that instantly conveys weather conditions at a glance.
The air quality visualizations, designed with traffic-light style indicators, have been praised for their clarity and ease of interpretation.
Additionally, the integration of current conditions with multi-day forecasts has proven valuable for professionals and everyday users alike, making the dashboard both practical and engaging.
Its ability to balance detailed environmental data with a clean, intuitive layout has made it a standout tool for weather intelligence.
Recap
The Weather Analysis Power BI Dashboard illustrates how powerful visual analytics can simplify complex meteorological data.
By uniting temperature trends, air quality indicators, and forecasts into one platform, it enables users to make decisions that impact agriculture, transportation, health, and leisure.
More than just a weather tracker, this dashboard highlights how data visualization can improve preparedness, safety, and daily planning in a rapidly changing climate.
Check Out Other Power BI Dashboards:
- Team Performance Dashboard
- Attendance Tracker Dashboard
- Carbon Emission Footprint Dashboard
- Player Performance Dashboard
- Procurement Dashboard
- Healthcare Analysis Dashboard
- Emergency Room Overview Dashboard
- Transportation & Logistics Dashboard
Enjoyed the post?