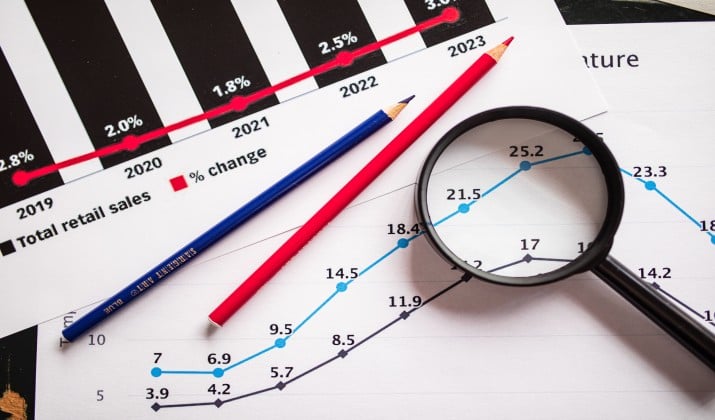
Imagine that a headline tells you 9 out of 10 people agree. Or a chart shows one bar towering over another. May be a friend sends you a screenshot that seems to settle an argument. You nod, maybe you share it, and you move on.
Later you learn the survey asked only 30 people, or the chart started at 90 instead of zero. What happened here is that nothing was invented. But, something was definitely left out.
Once you see the pattern, you start to read numbers differently. You ask who was counted, what was left out, and what the chart wants you to feel.
Can Statistics Lie Without Being False?
Think of a statistic like a photo. A photo can show a real moment and still leave out the full scene. Crop the edges or pick the one smile from a long bad day, and the story shifts.
Data works the same way. The number can check out while the message points in the wrong direction. That is the core idea behind these misleading statistics examples.
Most come from small slips: a weak sample, a chart that starts at the wrong place, a headline that drops the context, or a claim that treats correlation as proof.
This article walks through ten real world patterns, shows the flaw in each one, and leaves you with a simple way to check any claim before you share it.
Misleading Statistics Examples That Lie With Data
Each example below follows the same rhythm. First you see the claim. Then you see what hides behind it. Then you see a better way to read it.
1. The Tiny Survey That Speaks for Everyone
Claim: 82% of customers love our new flavor.
Reality: The survey went to 47 people who already bought the flavor twice and who answered an email within one hour. That group loves the flavor because they already chose it. Everyone else never got a vote.
This is one of the most common patterns because the math can be correct. 82% of that small group did pick the top rating. The lie sits in the leap from that group to all customers.
A sample must look like the people you want to describe. If it only includes fans, the result will tilt.
Fix it by asking three quick questions. Who got asked? How many answered? Who stayed silent? If the survey only reached happy buyers, treat the number as feedback from fans, not proof about the whole market.
Also read: Misleading Data Visualization Examples
2. The Average That Hides the Gap

Claim: The average salary at this company is $120,000, so pay must be fair.
Reality: One founder earns $900,000. Twenty two other people earn between $48,000 and $62,000. The average pulls upward because one large number drags it along. The typical worker earns far less.
Averages hide shape. When pay or home prices cluster at one end with a few large outliers, the mean tells a flattering story. The median, the middle value when you line everyone up in order, often gives a clearer picture of ordinary life.
Next time you see an average, ask for the median and the range. If a company will not share them, that silence tells you plenty. Fair pay lives in the middle of the distribution, not in one flashy average.
3. The Chart That Starts at 92 Instead of Zero
Claim: Our sales exploded this quarter, look at this chart.
Reality: Sales rose from 92 units to 98 units. That is a small gain. But the bar chart starts at 90, so the second bar looks three times taller than the first. Your eyes see a boom. Your brain skips the axis.
Misleading charts examples like this one work because people read bar length as size. When the axis starts above zero, a tiny change looks huge.
Line charts can do the same trick when the vertical scale squeezes a narrow range to fill the whole frame.
Fix it by checking the axis before you trust the shape. If a bar chart does not start at zero, ask why. A fair chart lets the bars speak at full scale.
Read this too: Bad Data Visualization Examples
4. The Cherry Picked Time Window

Claim: Crime fell 40% after the new policy started.
Reality: The chart starts in the single worst month in five years. Compared with that spike, almost any later month looks better. Compared with the three years before the policy, crime barely moved.
People pick start and end points to make a trend look strong. This is a classic form of misleading data analysis.
A short window can turn noise into a story. A longer view often shows a normal up and down pattern that was already there.
Fix it by asking for more years. Look for the full trend, not the slice that flatters the claim. If someone refuses to show the years before, you have a reason to pause.
5. The Percentage With No Base Number
Claim: Shark attacks doubled this year.
Reality: Attacks rose from one to two. Yes, that is double. It is also still extremely rare. The headline sounds scary because it hides the base number.
Percentages without raw counts are some of the slipperiest bad statistics examples.
A 200% rise sounds massive until you learn it went from three cases to nine. A 50% drop sounds like a win until you learn it went from two complaints to one.
Fix it by asking: percent of what? How many people, cases, or dollars are we talking about? A good report gives you both the percent and the count.
6. The Correlation That Pretends to Be a Cause
Claim: People who drink more coffee live longer, so coffee must extend life.
Reality: Coffee drinkers in the study also walked more, slept better, and had higher incomes. Coffee might help. Or the other habits might do the work. Or income might shape both.
Correlation means two things move together. Causation means one makes the other happen. Misleading statistics often blur that line. Headlines love a simple cause because simple causes get clicks.
Fix it by asking what else could explain the link. Could the arrow point the other way? Could a third factor drive both? Until a study controls for those options, treat the link as a clue, not proof.
7. The Survivorship Story That Erases the Failures

Claim: Every founder in this program built a million dollar business.
Reality: The program started with 200 founders. 190 quit, ran out of money, or closed. The story only interviews the ten who stayed. The failures vanished from the data.
This flaw shows up in investing, fitness, and school success stories. You only hear from the survivors. That makes success look normal and failure look rare. It also makes advice sound stronger than it is, because the advice was never tested on the people who left.
Fix it by asking who is missing. How many started? How many finished? What happened to the rest? A claim that counts only winners is not a guide.
8. The Simpson Twist Where the Total Flips the Story
Claim: Hospital A has a higher survival rate than Hospital B, so pick Hospital A.
Reality: Hospital A treats mostly mild cases. Hospital B takes the hardest emergency cases from across the region. When you split patients by severity, Hospital B does better in every single group. The total flips because the patient mix differs.
This twist is one of the trickiest statistical fallacies examples. A group total can reverse when you break the data into fair subgroups. It happens with schools, hiring, and medical results whenever the groups start from different places.
Fix it by asking for a breakdown. Compare like with like. Mild with mild. Severe with severe. If the headline only shows the total, you may be comparing two very different crowds.
9. The Map That Shouts With Size Instead of People
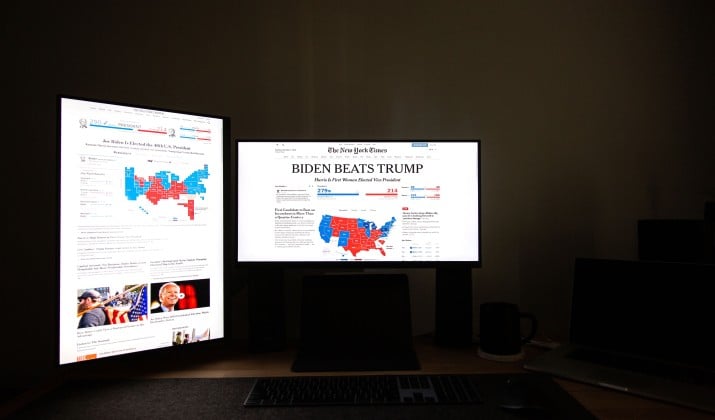
Claim: Look at all this red on the map. This view must dominate the country.
Reality: The red covers huge rural areas with few residents. The blue covers small cities packed with millions. Land area is not people. The map makes empty space look like votes, sales, or support.
Misleading graphs examples often use maps this way. A county map colors each county the same even when one county holds ten thousand people and another holds two million. Your eyes weigh area, not population.
Fix it by asking for a cartogram or a per person rate. A map that sizes each area by population tells a truer story.
10. The Before and After Photo With No Control Group
Claim: Our course doubled test scores in four weeks.
Reality: Students took a practice test, studied for four weeks, then took the same style test again. Scores rose. But scores often rise with practice, rest, and familiarity. Without a comparison group that did not take the course, you cannot tell what the course added.
Before and after stories feel convincing because change is visible. Yet people change for many reasons. Seasons and habits shift. Tests get easier to face the second time. Without a control group, you cannot separate the course effect from ordinary growth.
Fix it by asking: compared with whom? A fair test needs a similar group that did not get the treatment.
How Do You Spot Misleading Statistics?
You do not need a stats degree to spot misleading statistics. You need a habit. Slow down for ten seconds, then run through this quick check before you believe or share a claim.
Source check: Who produced the number and what do they gain if you believe it? A seller, a campaign, or a rival may frame the same data in opposite ways.
Sample check: Who was counted, how many, and who was left out? Small, self selected, or one sided samples rarely speak for everyone.
Base check: What is the raw count behind the percent? A 100% jump from two to four is not the same as a jump from two thousand to four thousand.
Time check: What start and end dates were picked? Ask for a longer trend to see if the spike is real or just a lucky slice.
Comparison check: Compared with what? A number means little alone. Look for a fair peer group, a control group, or a clear baseline.
Chart check: Does the axis start at zero? Does the visual match the numbers? Look for stretched checkscales, cropped bars, and maps that size by land instead of people.
Cause check: Does the claim jump from correlation to cause? Look for other factors that could explain the link.
Missing check: Who dropped out, who declined to answer, and what data never made the chart? Absence often shapes the story more than presence.
If a claim fails two or more of these checks, pause. That does not mean the claim is false. It means the evidence is too thin to act on. A strong claim welcomes scrutiny.
It also helps to read past the headline. Headlines compress. They drop caveats to fit a line. The chart footnote often holds the detail that changes the meaning.
How Can You Make Charts More Honest?
If you share data at work, in class, or online, you hold the same power. Small choices can keep your charts honest and your readers trusting you.
Start every bar chart at zero unless you have a clear reason not to, and label that reason in plain words. Show the sample size, the time window, and the source right under the chart. Give both the percent and the raw count so readers can feel the scale.
Avoid cherry picking dates to make a trend look better. Show the full period, even when the full picture feels less dramatic. If you use a map, size it by people or show a rate per person, not raw land area. If you claim a cause, say what you controlled for and what you did not.
A final note to carry with you: numbers do not speak for themselves. People give them a voice with choices about sampling, framing, and design.
When you learn to hear those choices, misleading data visualization loses its power. You start to ask better questions and make calmer decisions based on what the data actually shows.